
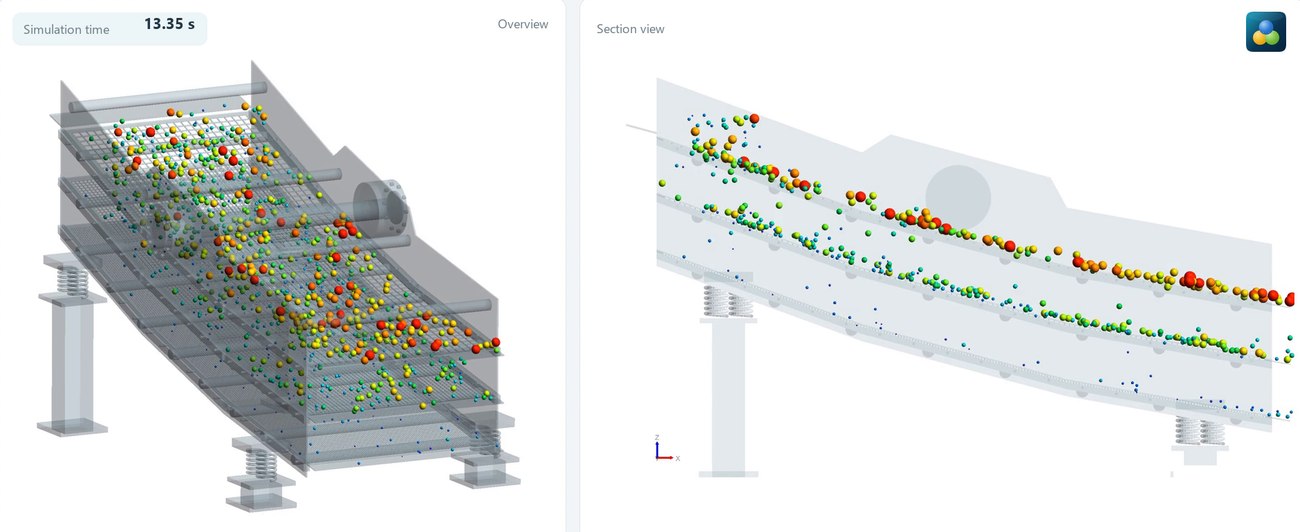
The case
| Parameter | Value |
|---|---|
| Length × working width | 6.0 × 2.4 m (14.4 m² per deck) |
| Decks | 3, spaced 0.55 m apart |
| Top deck | 80 mm opening, 20° inclination |
| Middle deck | 40 mm opening, 15° inclination |
| Bottom deck | 20 mm opening, 10° inclination |
| Prescribed motion | elliptical vibration at 12 Hz, X/Z amplitude of 3 / 6 mm |
| Simulated time | 20 s |
The vibration in numbers
At 12 Hz the screen completes a cycle every 83 ms, with angular velocity ω = 2πf = 75.4 rad/s. The peak acceleration of harmonic motion is Aω². Taking the case values as amplitude (half the total stroke):
| Direction | Amplitude | Peak velocity | Peak acceleration |
|---|---|---|---|
| Z | 6 mm | 0.45 m/s | 34.1 m/s² (3.5 g) |
| X | 3 mm | 0.23 m/s | 17.1 m/s² (1.7 g) |
At 3.5 g in the vertical, the screen accelerates downward faster than gravity for part of the cycle, and the particle loses contact with the deck. That lift-off gives it fresh chances to present itself to the openings. From the peak velocity, the ballistic hop is of the order of v²/2g ≈ 1 cm: small for a 90 mm rock, but comparable to the particles on the bottom deck.
What each deck retains
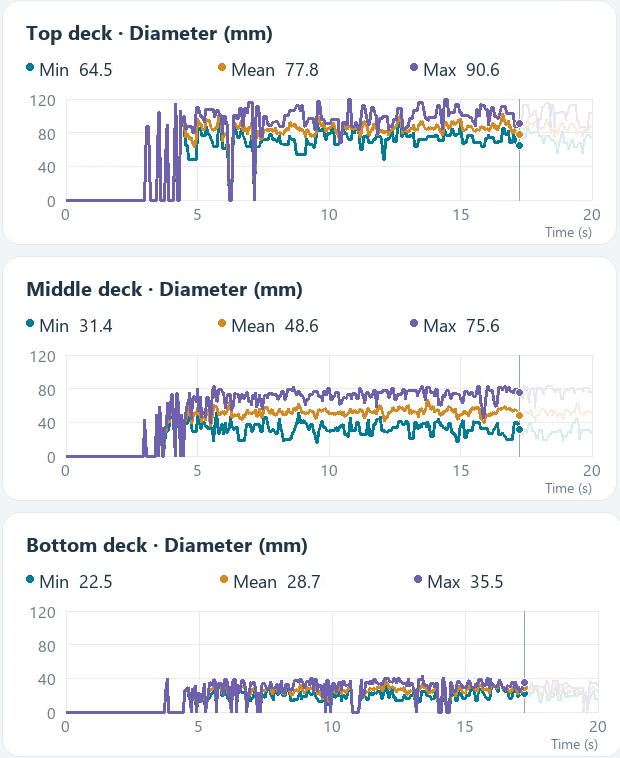
The charts start recording near 3 s, when the material front reaches the end of the decks, which suggests they measure what is near the discharge. From about 8 s the curves become continuous. Averaging between 9 and 17 s:
| Deck | Opening | Minimum | Mean | Maximum |
|---|---|---|---|---|
| Top | 80 mm | ≈ 75 mm | ≈ 87 mm | ≈ 101 mm |
| Middle | 40 mm | ≈ 34 mm | ≈ 54 mm | ≈ 75 mm |
| Bottom | 20 mm | ≈ 21 mm | ≈ 27 mm | ≈ 31 mm |
The maximum on each deck stays below the opening of the deck above (75 mm against 80; 31 mm against 40), and the mean diameter sits above the deck's own opening. The sequence of openings, each half the previous one, gives three well-separated product bands.
Why rocks smaller than the opening remain
The minimum on the top and middle decks is below the opening: 75 mm on an 80 mm deck and 34 mm on a 40 mm deck. These are particles that would fit but have not passed yet. That is the expected behaviour of near-size material. The chance of a sphere passing a square opening on a single attempt falls with the square of the remaining clearance, (1 − d/a)², ignoring wire thickness:
| d / a | Diameter at an 80 mm opening | Chance per attempt |
|---|---|---|
| 0.5 | 40 mm | 25% |
| 0.7 | 56 mm | 9% |
| 0.8 | 64 mm | 4% |
| 0.9 | 72 mm | 1% |
A 72 mm particle needs, on average, about a hundred attempts. If the deck ends first, it leaves with the retained material. That is why screen length and the time material spends on it weigh so heavily on the sharpness of the cut.
How the material moves
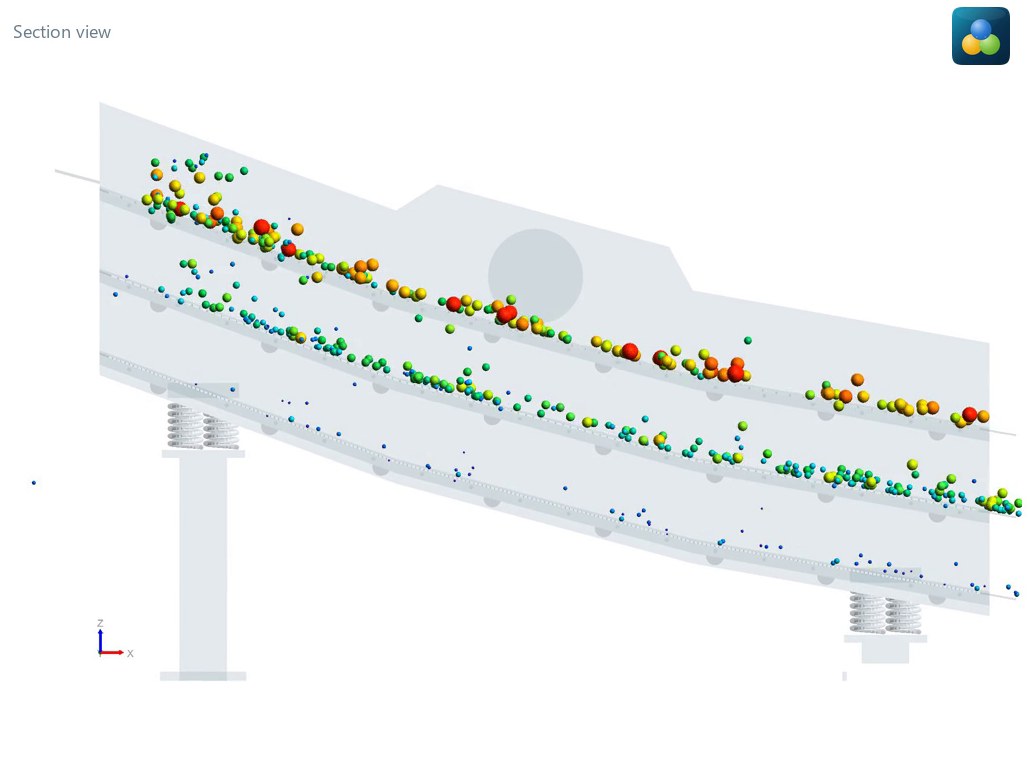
- Reaching the discharge: the top deck front advances at about 2 m/s and reaches the end near 3 s. The bottom deck starts recording material at about 3.8 s.
- Thin layer: material travels in groups, without forming a thick bed. At this load, small particles do not have to work through a layer of coarse ones to reach the screen.
- Decreasing inclination: from 20° at the top to 10° at the bottom. The bottom deck, which handles the finest material, is the least inclined.
The 2 m/s figure is the front, meaning the fastest particles. Being spheres, they tend to roll along the deck, and angular rock travels more slowly. This value should not be used as a design speed.
Simulate your screen
Build the screen in BrixDEM or contact us to study openings, vibration, inclination and feed for your equipment.