
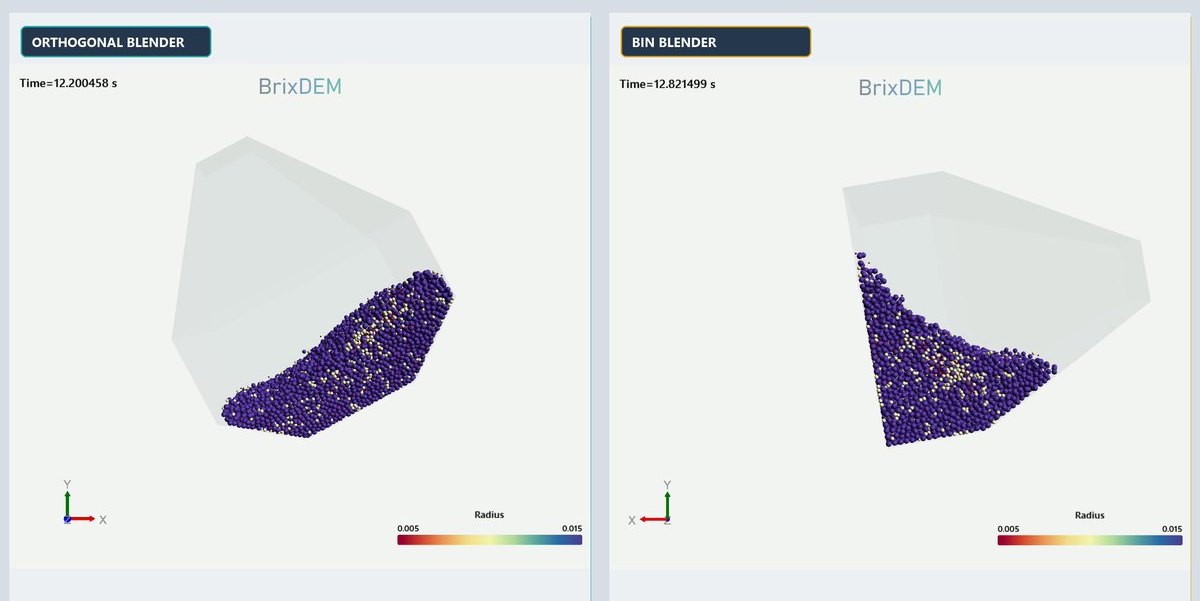
The two machines
Both are tumble blenders: a closed vessel rotating about an axis perpendicular to its length, turning the charge end over end every revolution. There is no paddle and no internal rotor. Gravity does the mixing, with material sliding from one end to the other.
Both have a square cross-section. What differs is the side profile:
The octagonal takes its name from that eight-sided profile: tapered at the bottom, straight in the middle, tapered again at the top. The bin is the container the pharmaceutical and food industries also use to move and store product, flat on top with a pyramid bottom for discharge.
A comparison with the variables pinned down
Comparing shapes means fixing everything else. Checked directly against BrixDEM's output files:
- Identical speed: 14.0 rpm in both, constant from start to finish.
- Identical charge: about 30,000 particles each, with radii from 5 to 15 mm. The mean force the load exerts on the vessel is 2,824 N in one and 2,819 N in the other.
- Same simulated time: 20 seconds, about four and a half turns.
The average says they are the same
Had the analysis stopped at the averages, it would be a dead heat:
| Steady-state mean | Octagonal | Bin |
|---|---|---|
| Drive power | 1,055 W | 954 W |
| Shaft torque | 720 N·m | 668 N·m |
| Load kinetic energy | 100 J | 145 J |
Mean power and torque sit within 10% of each other, with the bin even slightly lower. The only visible difference is kinetic energy: the bin's load moves 45% more. It looks like a point in its favour. It is not.
The peaks say something else
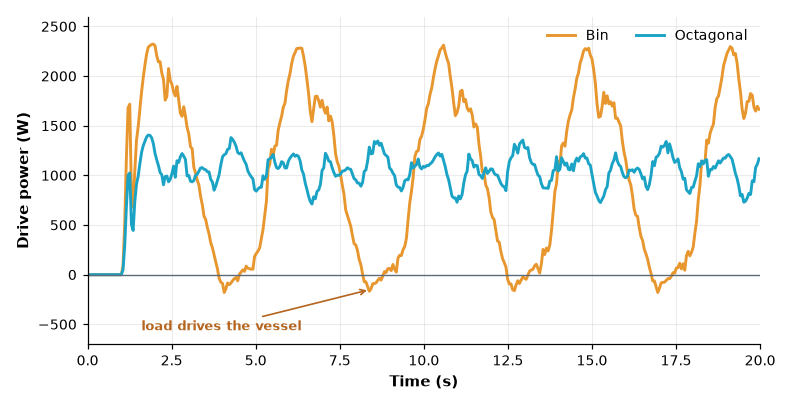
Put on the same axis, they are entirely different machines. The octagonal swings between 711 and 1,381 W. The bin runs from 2,312 W down to −180 W.
| Steady state | Octagonal | Bin |
|---|---|---|
| Maximum power | 1,381 W | 2,312 W |
| Minimum power | 711 W | −180 W |
| Peak-to-mean ratio | 1.3 | 2.4 |
| Power standard deviation | 144 W | 812 W |
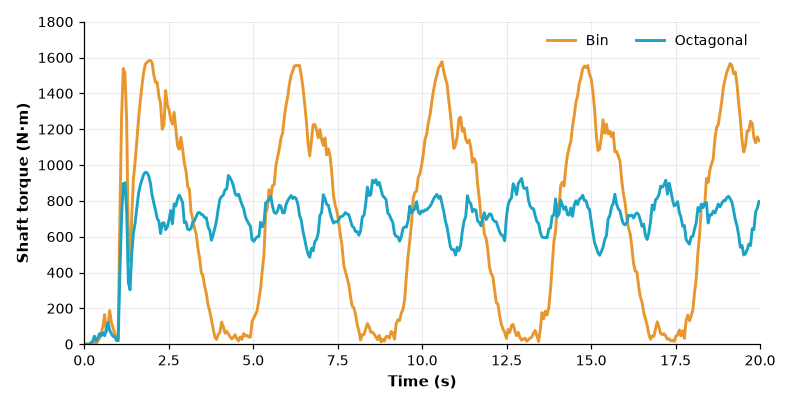
| Maximum torque | 942 N·m | 1,577 N·m |
| Minimum torque | 485 N·m | 13 N·m |
One oscillation per turn
The bin's rhythm is not random. Its power minima sit 4.26 s apart, and at 14 rpm one turn takes 4.29 s. That is exactly one oscillation per revolution, with an amplitude of 1,564 N·m peak to peak.
The octagonal oscillates too, but about three times per turn and with an amplitude of 457 N·m, three and a half times smaller.
The bin is the vessel with a single strong asymmetry, flat top on one side and pyramid on the other, and it is the one that oscillates once per turn. The video suggests the mechanism: the load slides as a block from the wide end to the narrow end and back, moving its weight far from the axis and then close to it. In the octagonal, tapered at both ends, the load cascades in smaller steps.
Why this matters to the designer
Motor and gearbox sized for the peak
A drive chosen from the bin's average power, about 1 kW, would have less than half of what it needs at the peak of every turn. On the octagonal the margin is much smaller: the peak is only 30% above the mean.
Fatigue
The bin's torque cycles from almost zero to almost 1,600 N·m every 4.3 seconds. That is about 840 cycles an hour, more than 20,000 a day in continuous operation, all at full amplitude. Gears, shaft and coupling feel the amplitude, not the average.
The load pushing the vessel
Negative power means that for part of each turn the load drops and pulls the vessel forward. The drive stops pulling and starts holding back. That makes the backlash between gear teeth close on one side and open on the other every turn, which hammers the teeth. It is a detail the average would never show, and it decides whether the machine needs a brake or a gearbox with controlled backlash.
And the mixing?
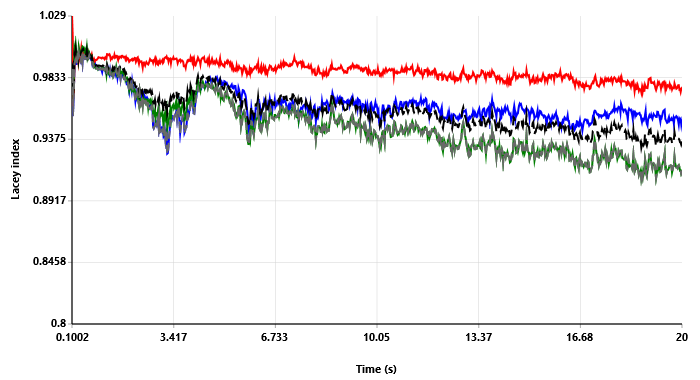
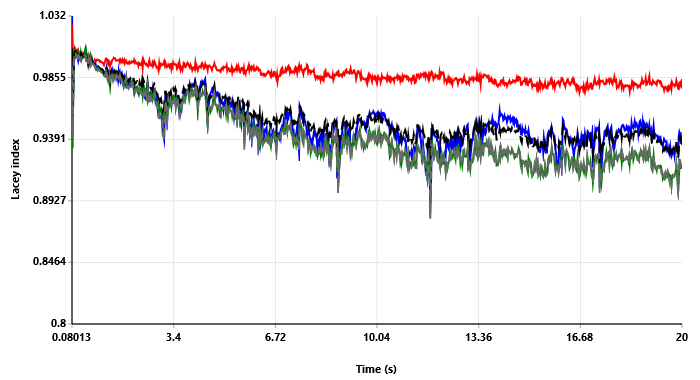
This is what closes the case. The Lacey index, which measures mixture homogeneity from 0 (segregated) to 1 (perfectly random), ends up practically the same in both. One fraction stays near 0.98; the others fall into the 0.91 to 0.95 range, in both vessels.
In other words, the bin's extra 45% of kinetic energy and its power peaks did not turn into better mixing. The load moves more, but it does not mix more.
And both curves fall over time. It is the same behaviour we showed in the ribbon mixer: with particles of different sizes, the very motion that mixes also separates fines from coarse. Showing up in three machines with such different working principles, a ribbon and two kinds of tumbler, reinforces that this is not about one particular design. It is the physics of a polydisperse charge.
The takeaway
- Look at the time series, not just the average. Two machines with the same average power can need completely different drives.
- Size for the peak and check fatigue. In the bin, the peak is 2.4 times the mean and torque cycles from zero to maximum every turn.
- Look for negative power. If it shows up, the drive will alternate between pulling and holding, and the gearbox has to be chosen for that.
- More agitation is not more mixing. Measure homogeneity separately and track it over time, because it can get worse.
Compare machines before you buy
BrixDEM records torque, power and the Lacey index over time. Run two designs under the same conditions and see the peaks the average hides.