
The case
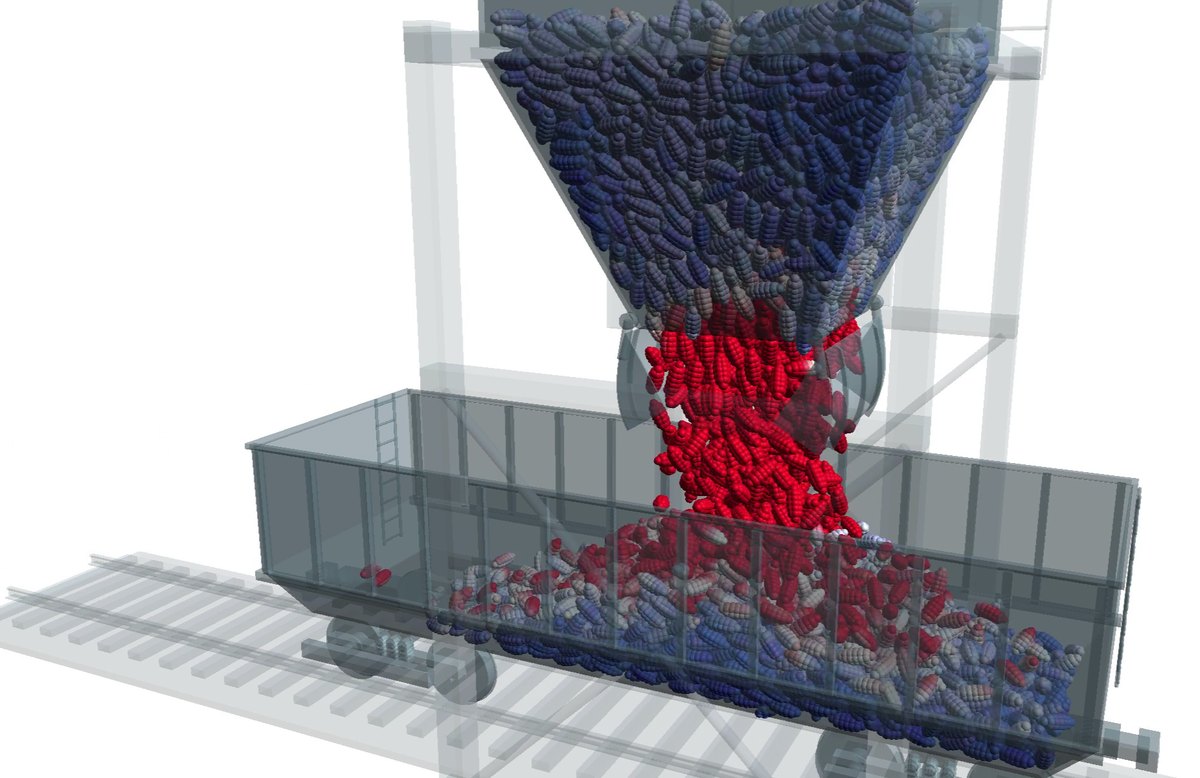
The station has three parts: an elevated silo, a two-shell clamshell gate at the outlet, and a railway wagon positioned on the track below. The simulated cycle is the real one: fill the silo, position the wagon, open the gate, load, close, and the wagon departs.
There are 190,624 particles, the largest model on this blog so far. And they are not spheres: although all of them use 50 mm spheres, particle mass ranges from 0.042 to 0.382 kg, almost ten to one. They are clumps, elongated multi-sphere particles built from different sphere counts. The capsule shape is visible in the image above.
That is not showing off. Elongated material interlocks, aligns and flows in ways no sphere reproduces, and in railcar loading, jamming at the gate is exactly one of the risks.
The cycle, second by second
The numbers below come straight from BrixDEM output files, unadjusted.
| Phase | When | What the data shows |
|---|---|---|
| Silo filling | 0 to 5.2 s | about 31,700 particles enter per second |
| Settling | 5.2 to 10.4 s | mean velocity drops to 0.01 m/s; kinetic energy vanishes |
| Gate opens | ≈ 10.4 s | maximum velocity jumps from 1.7 to 8.2 m/s |
| Loading | 11 to 19 s | peak of 17.4 m/s; potential energy collapses |
| Wagon departs | ≈ 21 s | kinetic energy rises again, now it is the load travelling |
The wait is not wasted time
The five seconds between the end of filling and the gate opening look like dead time, but they are not. Mean velocity falls from 0.07 to 0.01 m/s over that interval, and the coordination number, how many neighbours each particle touches, climbs to 4.1. The material is packing.
That matters because a silo discharging before it settles delivers unstable flow in the first seconds. If you have ever watched the wagon scale wobble early in a load, this is what that is.
The 1.7 MJ that has to go somewhere
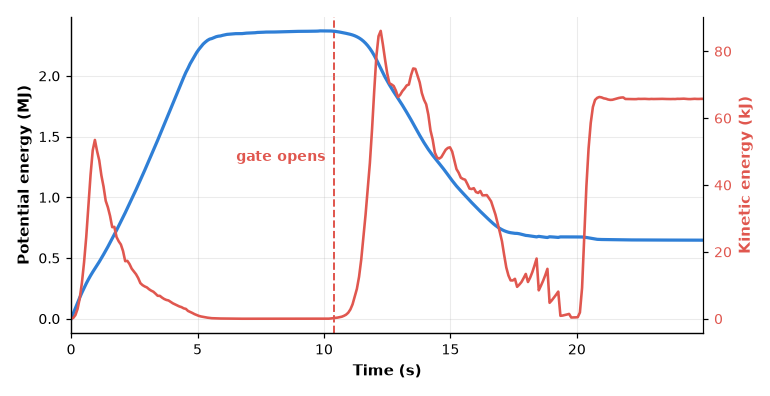
This is the most useful chart in the case. Potential energy climbs to 2.37 MJ with the silo full, stays flat through the wait, and falls to 0.65 MJ by the end of loading. The difference, 1.72 MJ, is what gravity delivered to the system in under ten seconds.
That energy does not vanish. It turns, in some proportion, into impact on the wagon floor, particle breakage, noise, and the dust that lifts when the stream hits the load. Anyone trying to cut dust emissions during loading is, in practice, trying to reduce that number or spread it over more time.
Notice too the red peak around 12 s: kinetic energy approaches 85 kJ and then falls, with the gate still open. That is the load already built on the wagon floor starting to cushion what arrives from above. The first material to drop is the one that hits hardest, against bare plate.
Impact velocity: 17 m/s
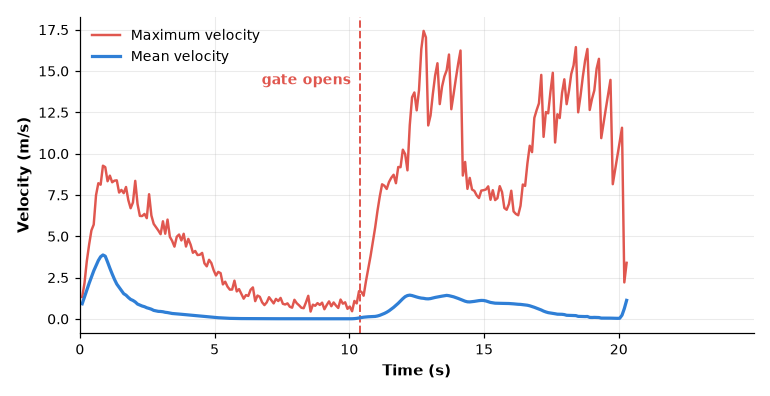
Maximum velocity passes 17 m/s during loading. For comparison, that is the speed of a body in free fall from a little over 14 metres. It is not the typical particle, it is the worst case, and it is what sets floor wear and breakage.
Mean velocity, meanwhile, barely exceeds 1.4 m/s at the same instant. That tenfold gap is the signature of every gravity transfer: most of the material has already arrived and is at rest, while a thin stream keeps falling. Looking only at the mean hides exactly the part that does the damage.
The load does not sit level
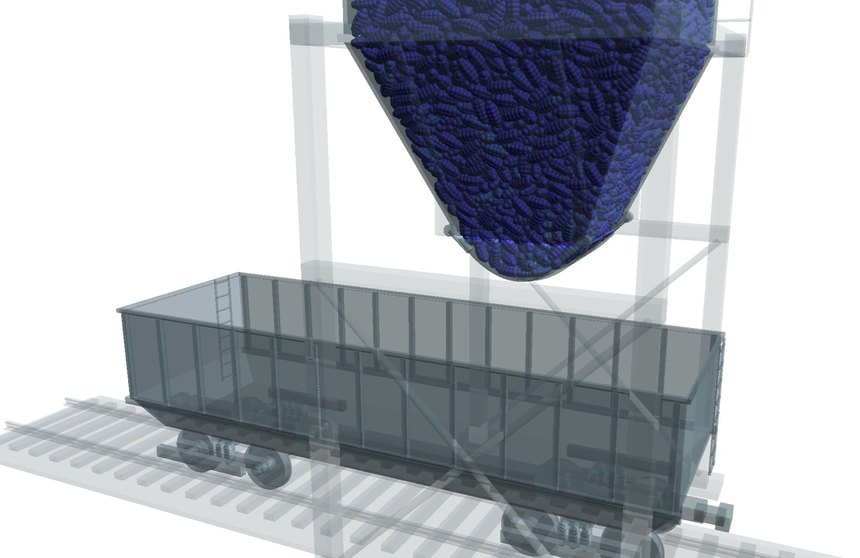
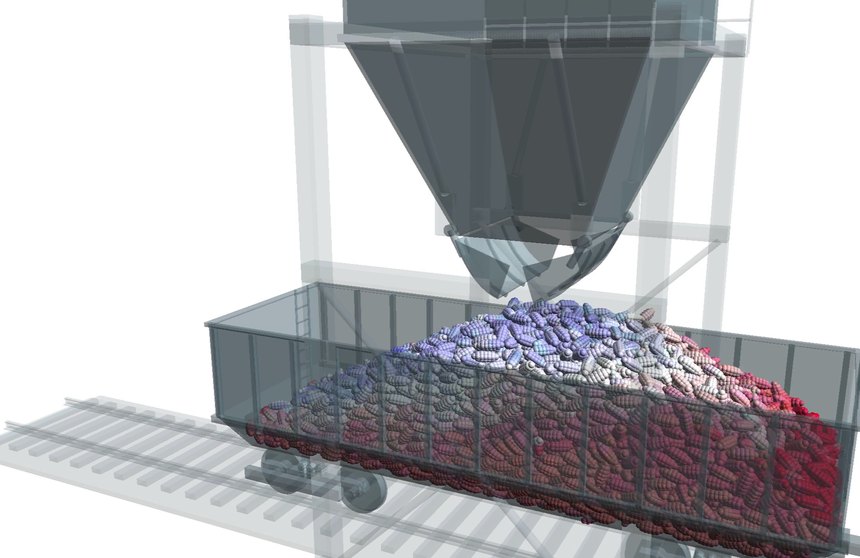
Material falls through a single point, so it piles around that point up to the angle of repose and only then spreads towards the ends. The result is a crown: high in the middle, low at the ends. That has three practical consequences:
- Lost capacity. The wagon reaches its height limit in the centre before it is full at the ends.
- Overflow risk. Keeping the gate open once the crown reaches the rim throws material outside.
- Weight distribution. A load concentrated in the centre is not the same thing, for the bogie or the track, as a load spread evenly.
That is why real stations index the wagon during loading, or use more than one discharge point. Simulation lets you test how many stops are needed, and where, before anything is installed.
What this lets you decide
- How many stops per wagon. One discharge point builds a crown. Two or three level it better, at the cost of a longer cycle. The break-even depends on wagon geometry and the material's angle of repose.
- How long to wait before opening. The data shows when the bed stopped moving. Opening earlier costs flow stability.
- Where to reinforce the floor. The first material lands on bare plate at maximum velocity. After that, the load itself cushions.
- Whether the gate jams. With elongated particles, the risk of arching at the opening is real. Running the actual shape is the only way to see it beforehand.
- Where dust is born. The kinetic energy peak names the moment and place of greatest agitation, which is where dust suppression pays off most.
The takeaway
Loading a railcar takes less than ten seconds and concentrates everything that usually goes wrong: impact, dust, uneven distribution and jamming risk. None of it is observable from outside, with material falling inside a steel body.
What simulation delivers is not confirmation that the wagon fills. It is the answer to when to open, for how long, and how many times to index. Those are operating decisions, and they are expensive when discovered on the scale.
Simulate your loading station before installing
Import the CAD, use multi-sphere particles with the real shape and read energy, impact velocity and fill profile before the station exists.